
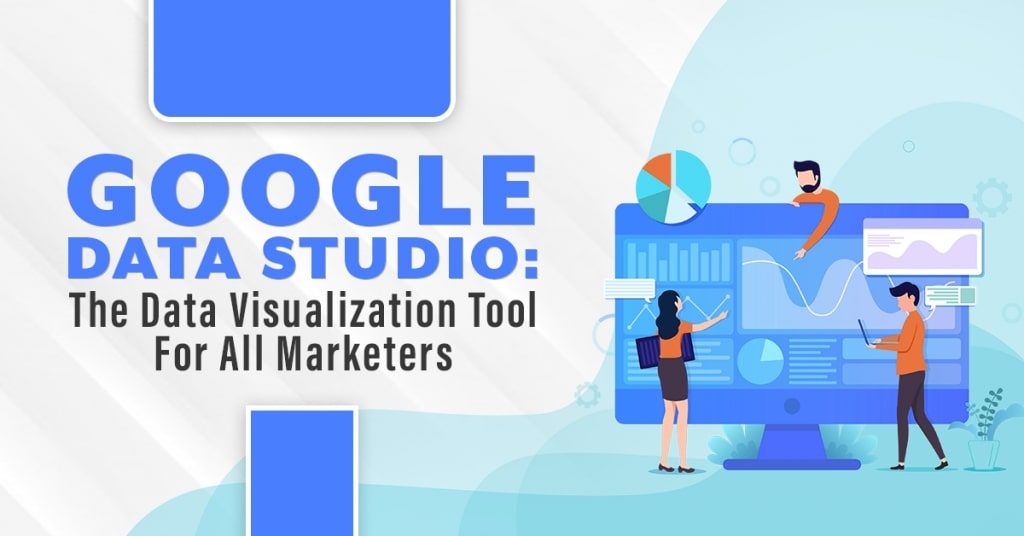
Google Data Studio: The Data Visualization Tool For All Marketers
Marketing is more than just collecting, analyzing, and interpreting data. It’s also not limited to simply conducting research and identifying market trends to follow. In reality, marketing experts segregate their data into categories that fit their needs and generate insights with the use of data visualization tools like Google Data Studio.
In fact, data visualization has a lot of benefits for all kinds of businesses. For instance, it helps marketers present complex information into more bite-sized graphics. This way, you can report simplified information. Nevertheless, you still have the option to view additional details when needed. Using these tools avoids overwhelming your readers. Data visualization tools also allow marketers to identify changes in the market and respond to them in real-time. Furthermore, it presents information in a way that promotes further discussion among the team.
However, in order to fully maximize the benefits of data visualization, we must first acquaint ourselves with popular data visualization tools like Google Data Studio.

Source: flickr.com
What is Google Data Studio?
Google Data Studio is a free reporting and data visualization product. It’s a part of the Google Marketing Platform and is integrated with Google Cloud. Essentially, it allows marketers to convert simple statistics into stories with more personal, human experiences. This ultimately leads to fostering teams that can make smarter business decisions. And as a result, companies grow closer to achieving their missions, visions, and goals.
Easy Data Modification
Google Data Studio allows you to transform your data, create reports from scratch or with pre-made templates, and manage dashboards without the need to use code and SQL queries. You can even customize your reports and dashboards. Moreover, you can insert your company or clients’ logos and other relevant icons, change its colors, and select the fonts, line styles, and object properties to match your branding. You can also insert shapes and images to act as markers that emphasize important aspects of data. Save it as a reusable, shareable template to use again later when you’re satisfied with the design.
Furthermore, you can present your actual data in the form of various graphs, charts, and pivot tables to make them stand out and come alive. A few other visualization options include time series, heat and geo maps, scorecards, and scatter, bullet, and area charts. Each of these come with their own built-in comparison functions that allow you to view how the data has changed over time. You can also make reports more interactive with the use of added filters and date range controls.
Collaboration
While Google Data Studio is an alternative to using Google Sheets, it allows the same “Share” functionality. This means that your clients and team members can view, edit, and collaborate with you on the reports in real-time. Your data are also automatically updated when changes have been made in the original, source data used as a reference because of its dynamic nature.

Source: pexels.com
Data Connectivity
Google Data Studio has pre-built data connectors. This means you can easily import any of the data in your spreadsheets into Data Studio. Moreover, you can easily import any existing data you have from your social media ads on Facebook, Twitter, Reddit, and other platforms. Furthermore, you can also track your Google Ads, Google Bigquery, MySQL, Campaign Manager, Analytics, among others. As a bonus, no matter where your data came from, the reporting solution takes care of your data authentication, data structure, and access rights.
Additional Functionalities
Moreover, its interface was designed to be intuitive and easy to use for both beginners and professionals. Its report editor allows users to interact with a snap-to-grid canvas and drag-and-drop objects that have full custom property panels.
Google Data Studio lets you calculate and analyze your raw data by using the string, date, and mathematical functions. You can use these standalone or as part of a combination to generate more complex calculated fields. In addition, you can also create custom formulas that make use of text and numeric values and fields from the data source. Plus, you have arithmetic, comparison, logical, and unary and binary operators. Finally, it accommodates ad-hoc queries and lets you explore data tables visually in just a few clicks.
What Data Visualization Tool Do You Use?
With Google Data Studio, marketers can make use of visual art to identify trends and patterns from the data collected. Consequently, they can present the information in an interactive and organized manner that establishes more productive meetings. In turn, the team can then make a more informed decision that leads to the fulfillment of their goals. And when your team meets your current objectives, you are driven to set higher standards. You can then use these tools once again and the cycle continues. Knowing all this, it’s time to maximize the benefits of these data visualization tools to boost your Search Engine Optimization (SEO) ratings and more!
About Axel May Rivera
Axel is an avid fan of many dramas and songs. She is always eager to explore and discover more when it comes to movies and entertainment, especially in Korean and Filipino culture. In her free time, she enjoys reading books and playing badminton.

Related News:


The Google E-E-A-T Principle: A Guide

Top Hospitality Themes for WordPress Developers


How the Retargeting with Facebook Ads Strategy Works


Comment 0