
Expert Infographic Creation Tips for Visual Storytelling
Infographics – short for information graphics – have been one of the most effective ways to capture the audience’s attention and enhance engagement. By transforming complex data into digestible visuals, it helps your audience to connect with and understand your content better.
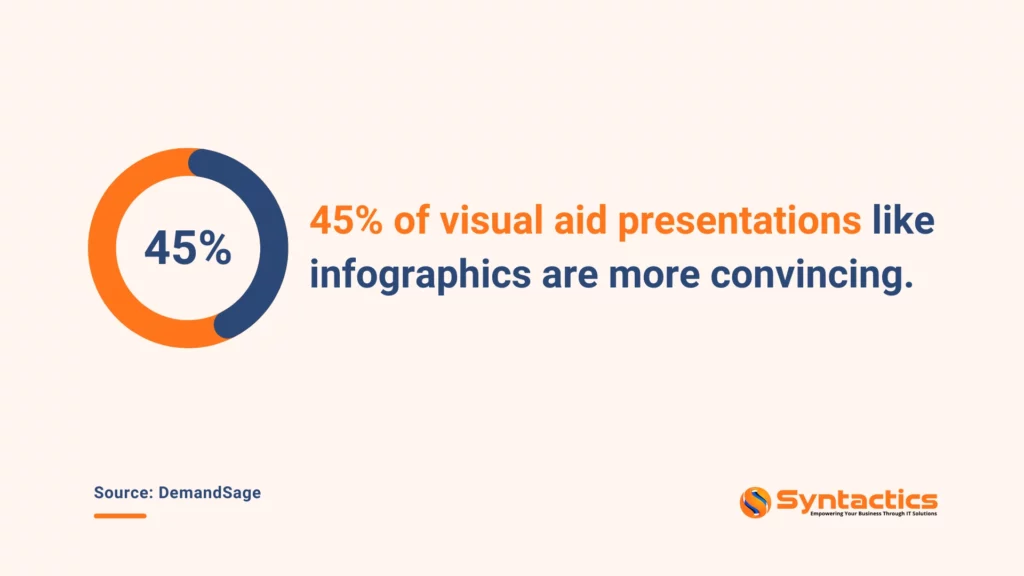
Source: DemandSage
With stunning infographics, you can significantly boost your credibility on any subject you discuss. Moreover, it acts as a powerful tool you can use to showcase your expertise in a visually engaging way.
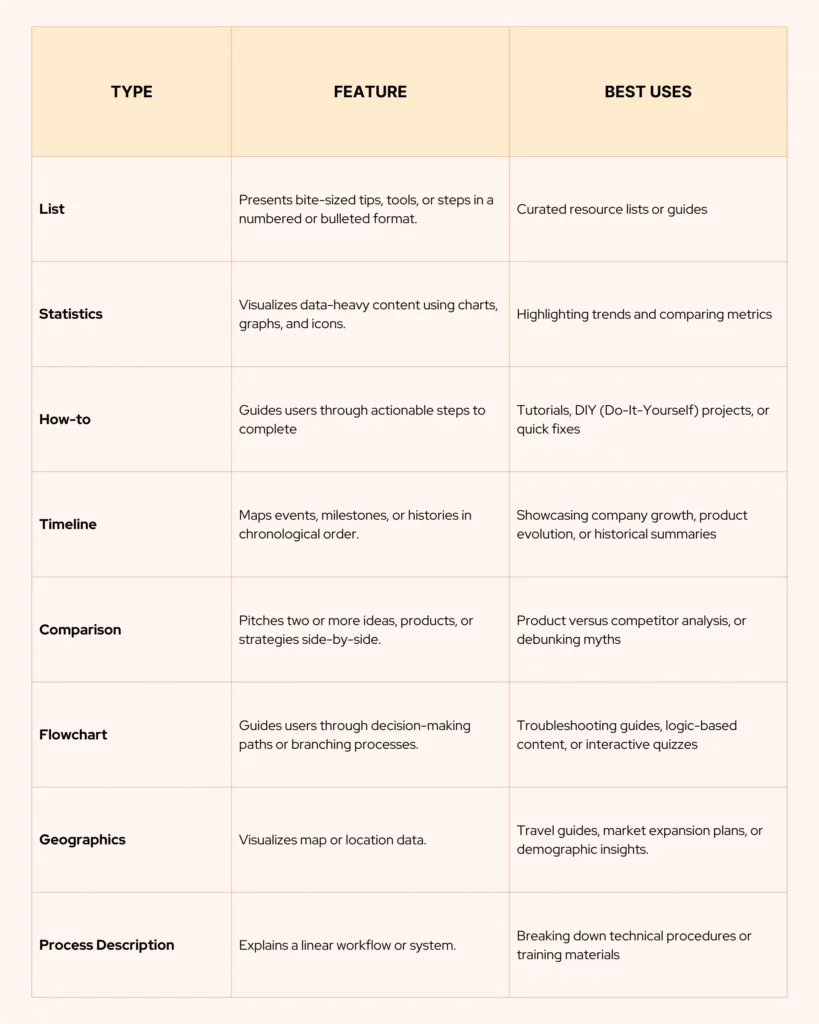
Types of Infographics and When to Use Them
Choosing the right format ensures your message resonates with your target audience. Below are the most common types of information graphics and when to use them for maximum impact:
3 Essential Tips for Infographic Creation
Creating infographics involves thoughtful planning, compelling data, and strategic design. To ensure your infographic is informative and impactful, follow these essential stages of creating an appealing template.
Data Gathering: Build a Fact-Driven Foundation
Using infographics can help you present clear and specific insights. Unlike standard blog posts, information graphics offer specificity.
Here’s how to get started:
- Choose a laser-focused topic that is suitable for and relevant to your target market.
- Determine one key takeaway you want to anchor your narrative.
- Look for high-impact statistics, examples, and credible quotes.
Pro Tip: Blend complex data with relatable anecdotes to boost shareability.
Content: Balance Brevity and Depth
While it may be tempting to include every single detail of the story, strive to avoid getting too carried away. However, working with an expert graphic design services agency can help align on scope and select an infographic template that fits your data.
Trim redundancies: Use the infographic to highlight insights and let the blog elaborate on the context to avoid duplicate content.
Prioritize clarity: Use concise headlines and subheadings. Every word should earn its place and clear purpose.
Design: Visualize with Purpose
Before designing, take the time to give your content one last review and ask:
- Are there too little, too many, or just enough details included?
- Does the headline instantly hook the audience?
- Is the content standalone and shareable without the blog post?
When designing, ensure to follow these essential tips:
- Theme first: Align color palette, fonts, and layouts with your topic and brand.
- Break conventions: Experiment with vertical, horizontal, or interactive formats.
- Optimize flows: Use icons, charts, and white space to guide the eye.
Final Thoughts
An infographic doesn’t have to be the end of your audience’s journey with your brand. Encourage further engagement by including a Call to Action (CTA) — whether it’s visiting your website, exploring more content, or reaching out. Subtle incorporate your logo so viewers know where to find more informative content.
Lastly, it’s also essential to track your success metrics to evaluate performance. Understanding what resonates and aligns with your audience will provide valuable insights. This way, it helps you refine and enhance future infographics for an even better impact.
Bring your ideas into life with visually appealing infographic designs. Collaborate with expert graphic design services in the Philippines to make your message stand out and captivate your audience.

This blog was updated on March 11, 2025
Frequently Asked Questions About Infographics
What are the key elements of a good infographic?
A well-designed infographic includes the following:
- A clear and engaging headline;
- Well-organized and relevant data;
- Visually appealing graphics and icons;
- A logical flow of information, and
- A strong Call-To-Action (CTA).
Where can I use infographics?
Infographics are versatile and can be used on websites, social media, presentations, email marketing, blogs, print materials, and more.
Can I create an infographic myself, or should I hire a designer?
If you have design skills, you can use tools like Canva or Adobe Illustrator. But, for a polished and professional look, hiring a graphic design expert ensures high-quality results tailored to your brand or business. Contact one of our experts today!
About Jalou Batilong
Most every great writer is a voracious reader, and no word describes Jalou better. Jalou enjoys a good read whenever she has the time to sit down and open a book or browse for interesting articles. It's through reading that she is able to digest information so easily, and write her own unique piece of information to share to everyone else.
- Find more about me on:


About Jalou Batilong
-
Find more about me on:
Related News:

Software Development Costs and Tips on Reducing Them

eCommerce Web Designs & How They Convert Visitors

5 Travel Marketing Trends That Boost Tourism

SEO Packages for Business: What You Need to Know


Comment 0